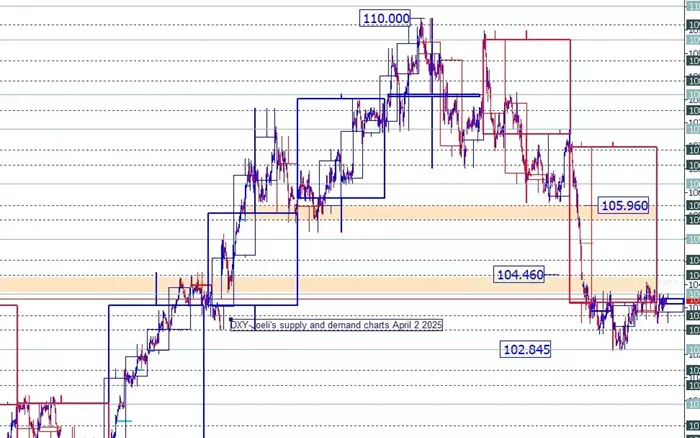
The US Dollar Index (DXY) surged over 4% from strong support levels earlier this year but hit resistance at the yearly downtrend in April. Since then, it has dropped nearly 2.6% from its monthly peak.
The recent rebound appears fragile as the index remains below the weekly high, with key U.S. core inflation data due before the month ends adding to market uncertainty.
Technically, the index faces resistance at 100.35, 100.65 (a critical level), and 100.98. Support levels lie at 99.40/47, 98.79, and a key zone between 97.71 and 98.39. The index bounced off support around 99.40/47, which aligns with the 61.8% retracement of April’s rally and May’s low close.
However, it must break above 100.97 (the 61.8% retracement of the recent decline and Friday’s close) to confirm a significant bottom and a breakout from the yearly downtrend.
If the index falls below recent weekly lows, the broader downtrend could resume, targeting support near 98.79 and the 97.71-98.39 range, which is defined by important historical price points from 2018 and 2025.
The US Dollar has broken below a multi-week uptrend, suggesting bears are trying to push the index lower within the yearly downtrend. For traders, rallies should stay capped below 100.65 if the downward move continues, while a close under 99.40 could accelerate the decline.
Investors should watch closely for the upcoming U.S. core personal consumption expenditures (PCE) inflation data, which could influence the dollar’s direction as the month closes. Weekly closing prices will offer further clues on whether the dollar will regain strength or continue its slide.
This technical outlook highlights the battle between bulls and bears in the short term for the US Dollar Index, with key levels to watch shaping the near-term trend.
Related topics:


